Elevating the user experience of the Digital Business Environment for Clients.
Role
Industry
Duration
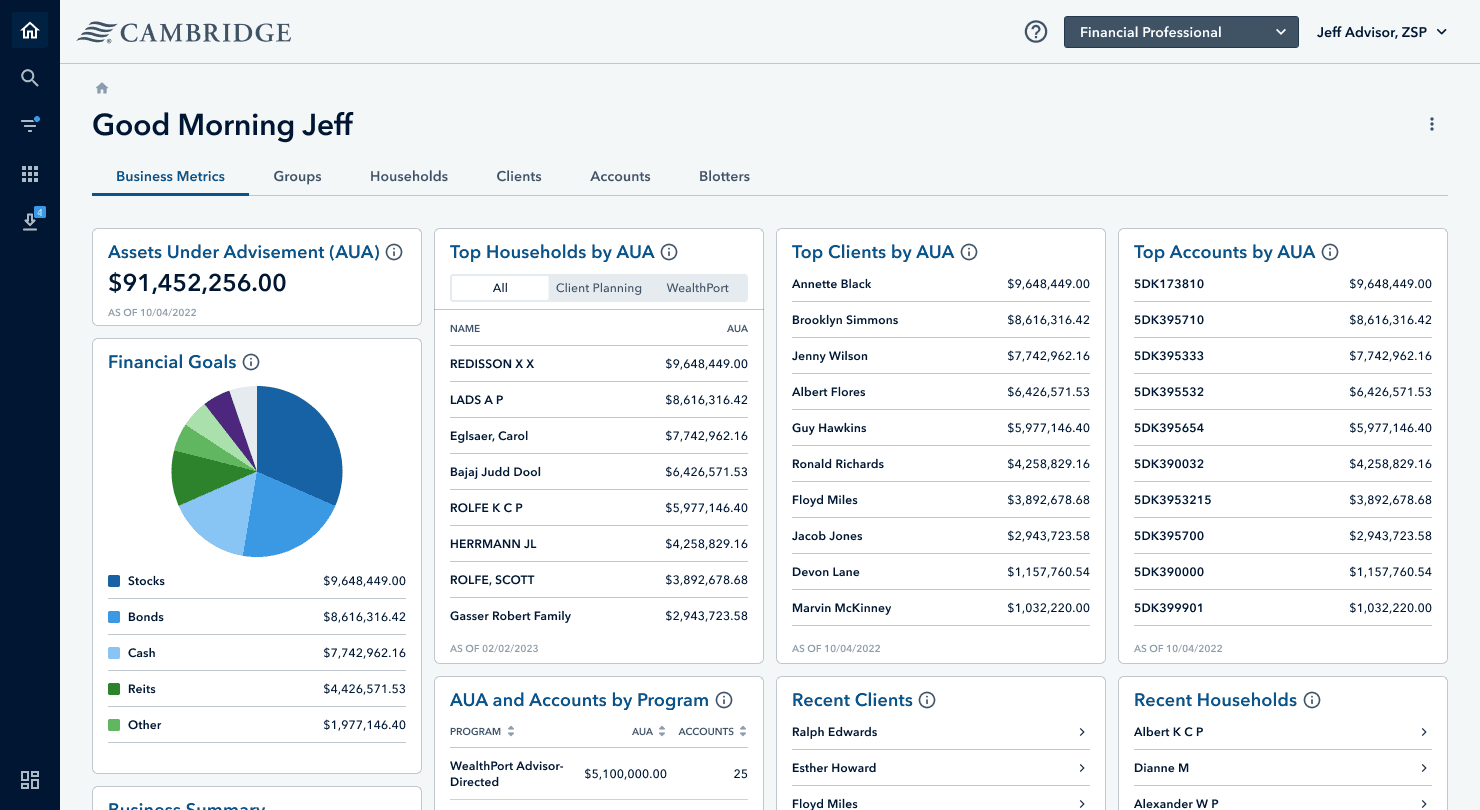
The advisor portal is a digital platform designed to provide advisors, such as financial professionals, with the tools and resources they need to manage their client interactions and services effectively. This portal centralizes information, offering advisors access to client profiles, data insights, performance metrics, and relevant documentation.
In addition, the advisor portal integrate analytics that provide personalized recommendations or insights that help advisors offer tailored advice and enhance client experiences. The advisor portal streamline workflow, improve efficiency, and ensure a more organized and proactive approach to managing client relationships.
Users
Business Executive:
Can view information about all the firms and in aggregate
Cannot view client names and personal info
Admin:
Can view everything about his firm, including client information
Cannot view other firms infos
Financial Professional:
Can view only the information about his firm that is linked to their clients
Cannot view the firm information as a whole.
Theming
All components on the platform can dynamically adapt to match the user's preferred theme, whether dark or light.
Light mode
Dark mode

Accounts
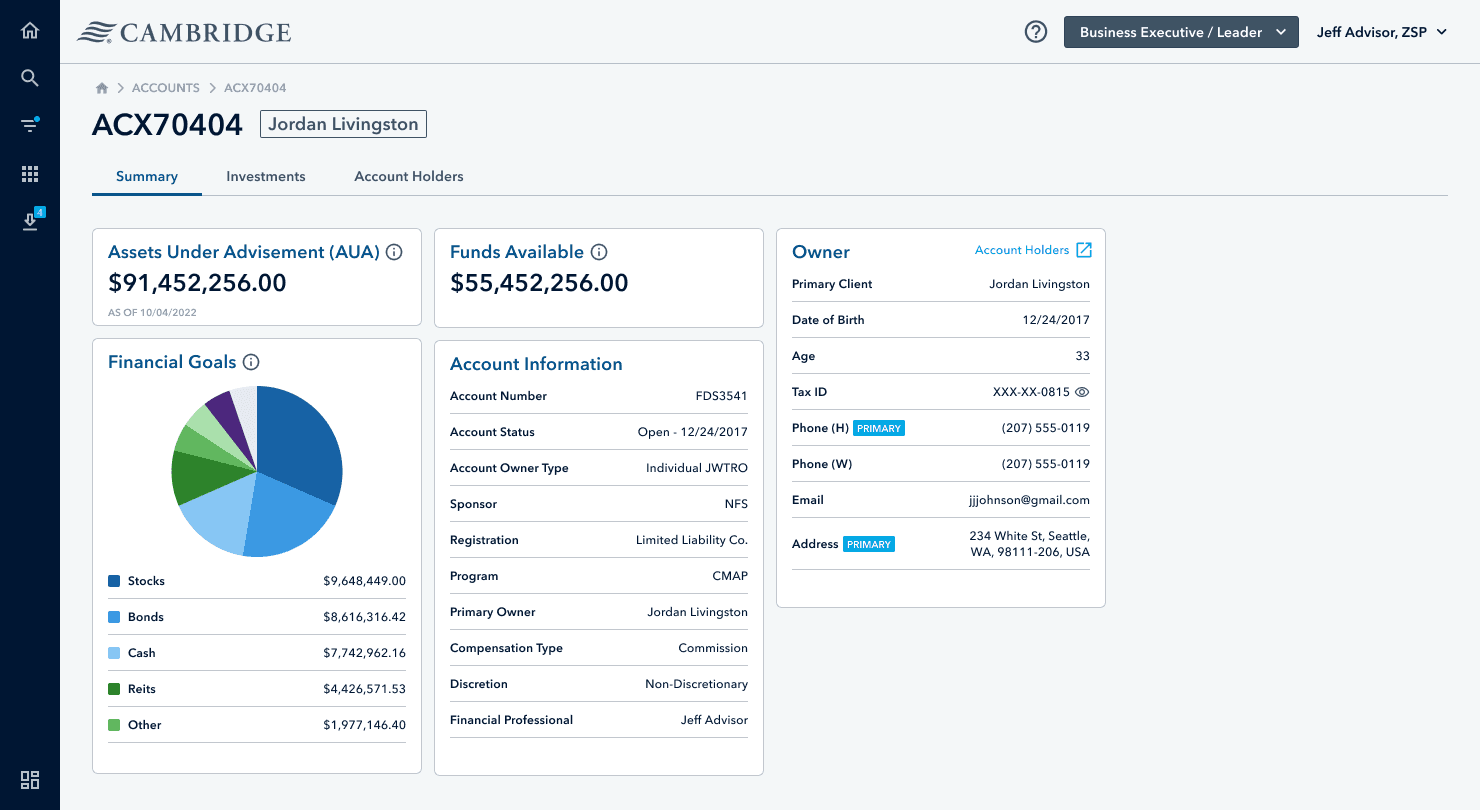
The user can easily see all the accounts under their administration and go deep into the details analytics of each account.
List view
With the list view the advisor can sort their accounts by the most relevant category and export it with their own configuration.

Detail View
The advisor can see a dedicated dashboard for each of their accounts.
Personalized dashboards
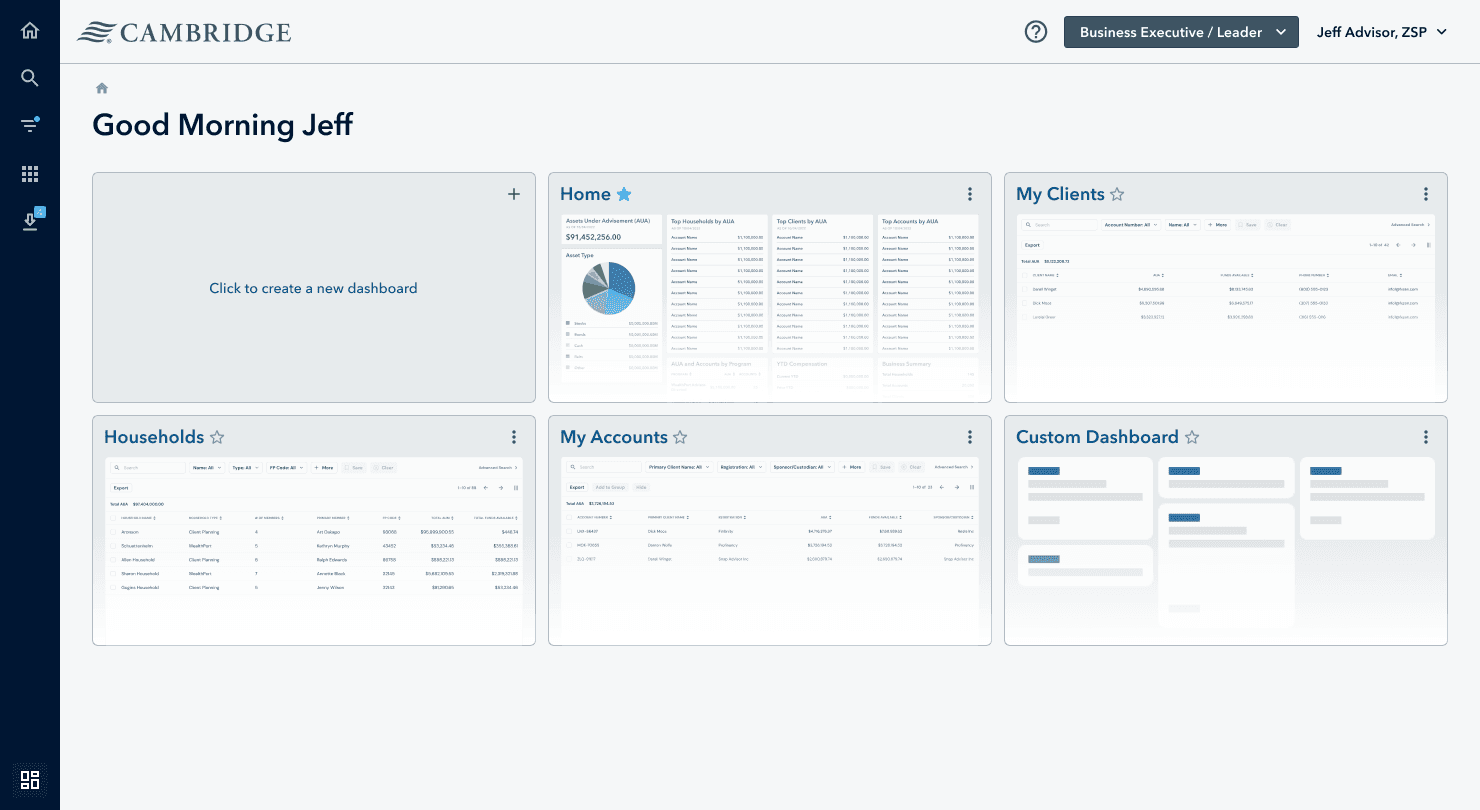
Users can tailor their experience by selecting the dashboard that best suits their needs, with the option to mark favorites, seamlessly switch between dashboards, and even create custom ones.
Switching dashboard
The user can easily switch between their favorites dashboards.
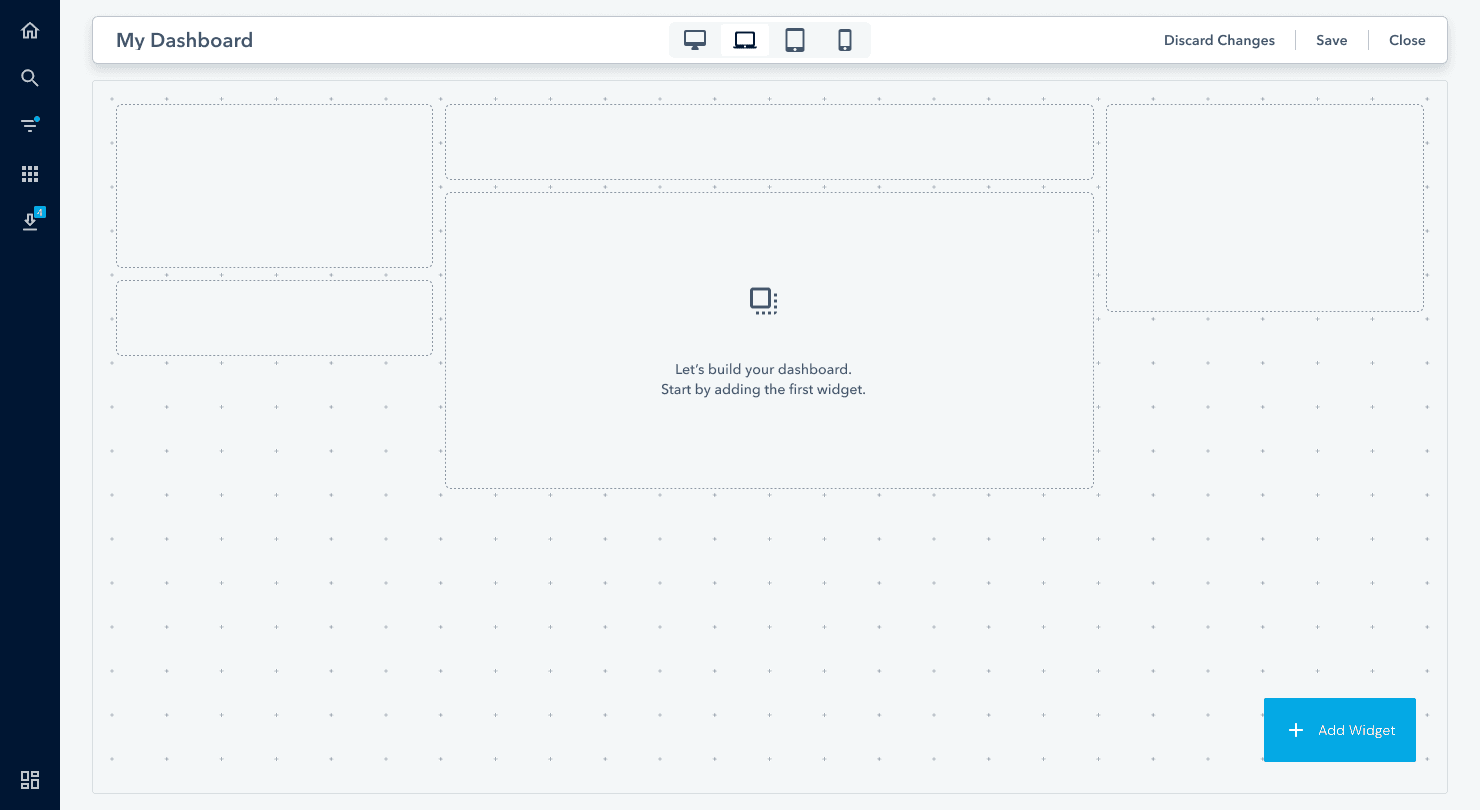
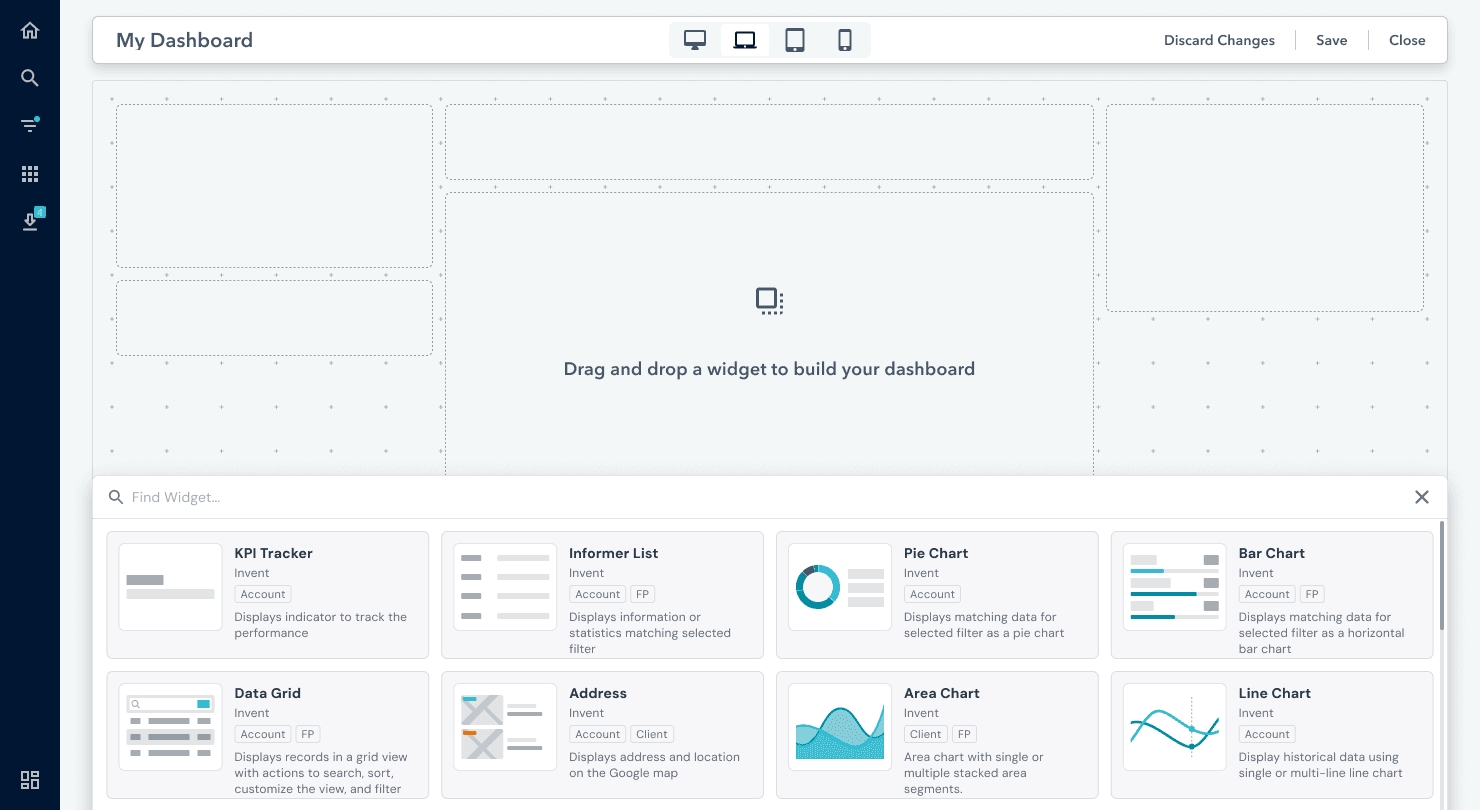
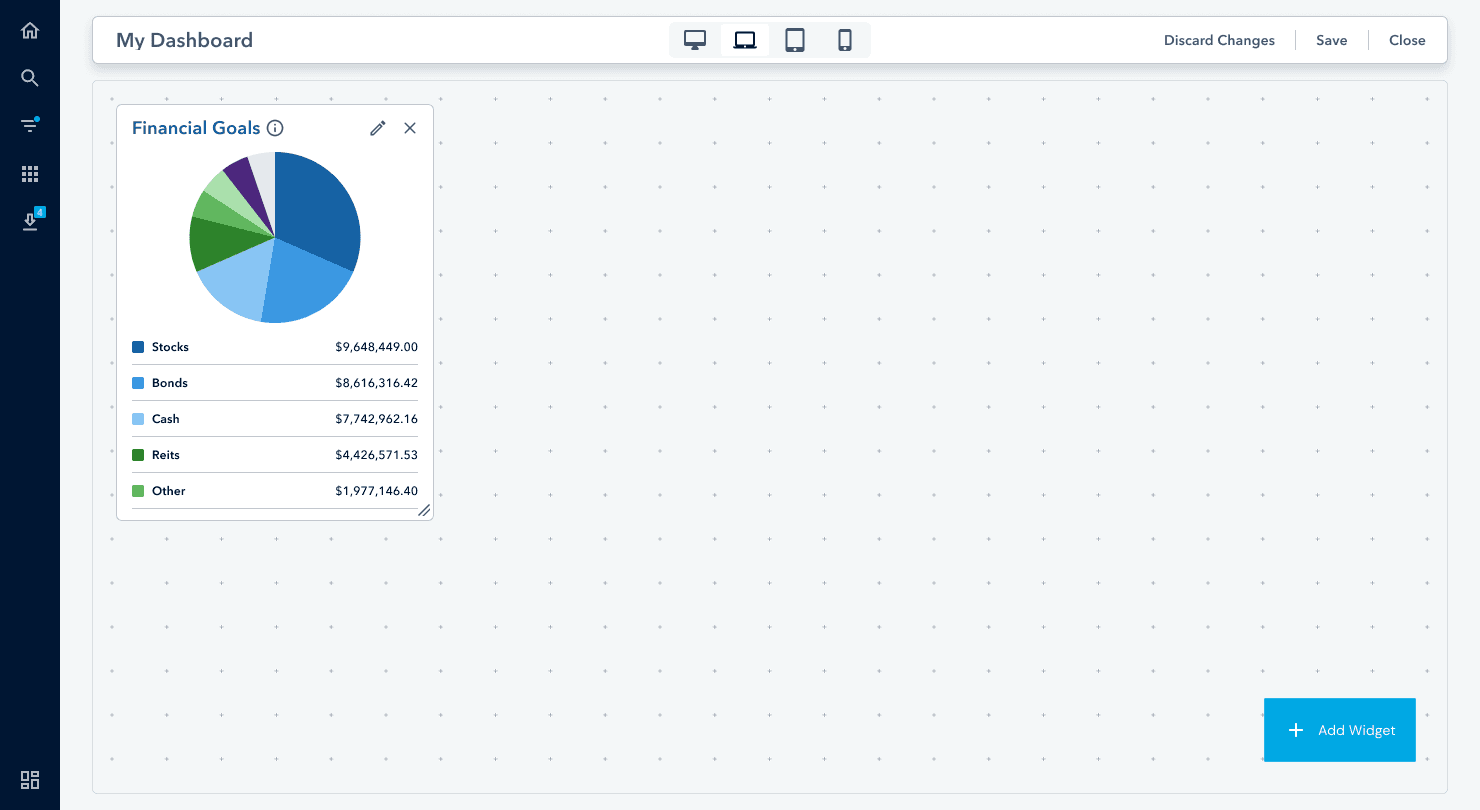
Create a custom dashboard
The advisor can customize their own dashboard using the creation tool. By clicking to add a new widget from the widget library, they can easily select and resize widgets to create their ideal data visualization experience.
Revenue
Users can effortlessly access detailed information about their revenue through customized dashboards and lists, uniquely designed for each user type.
Business executive - (All FP)
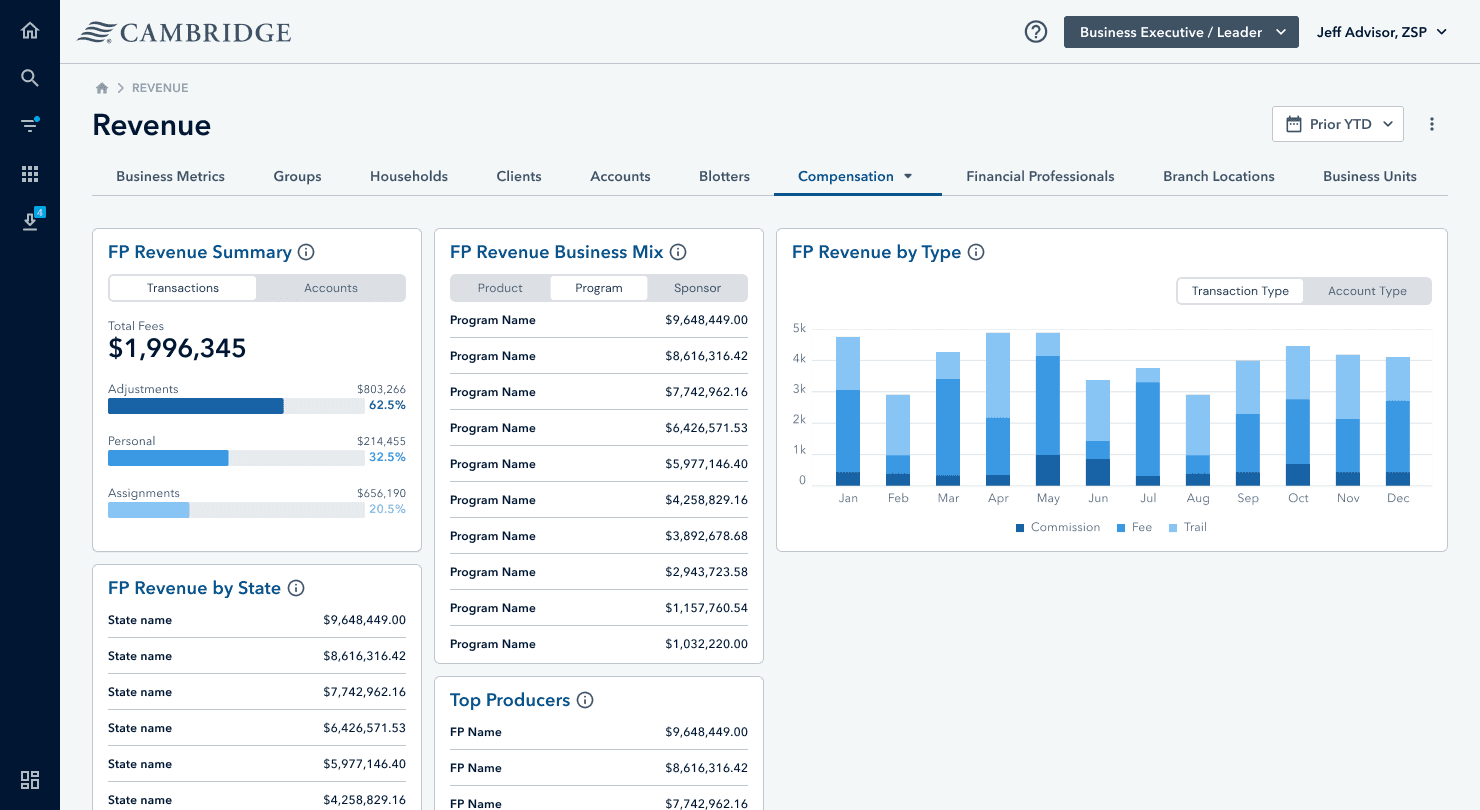
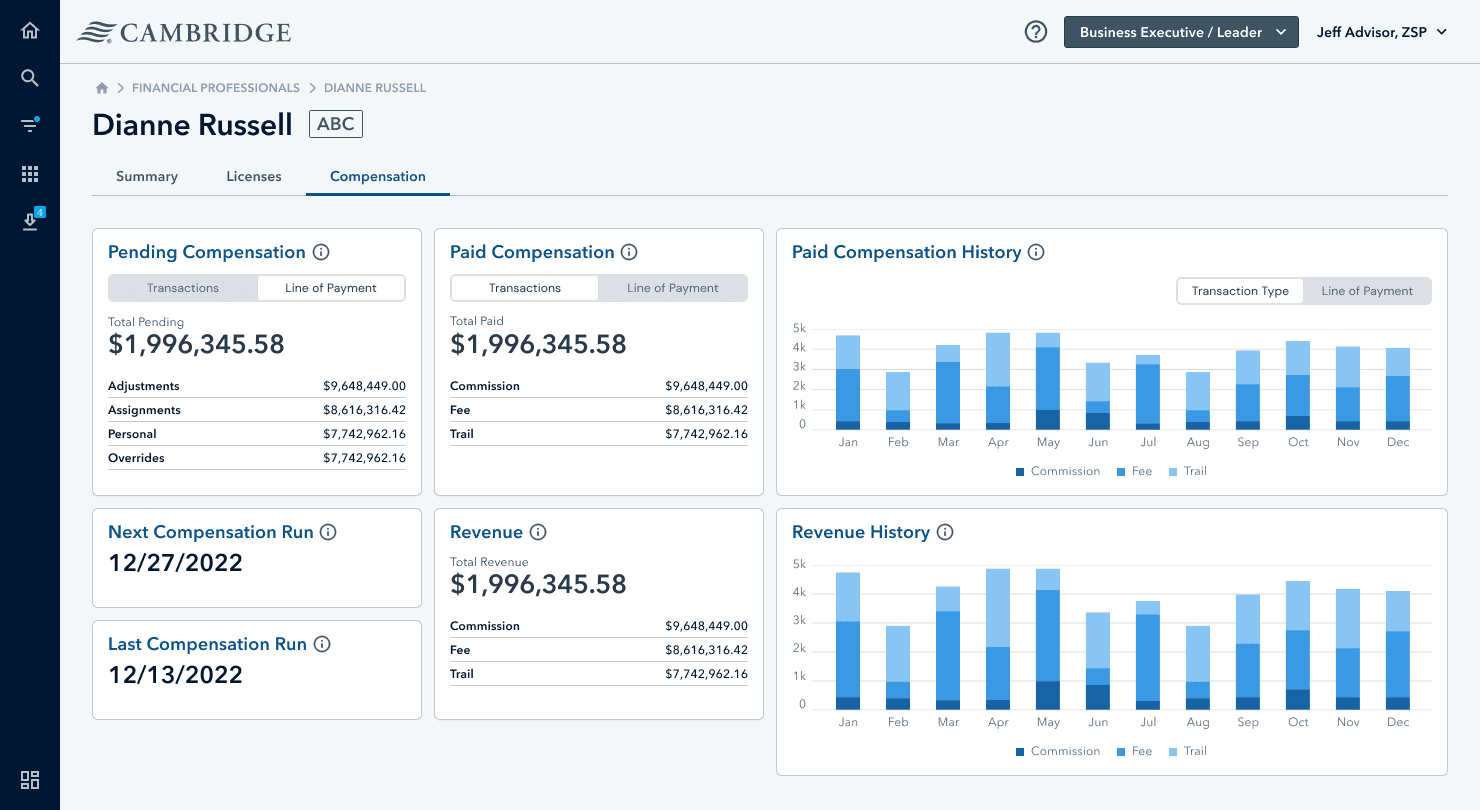
The business executive can view the combined data for the FPs under him.
Business executive - (Selected FP)
The business executive can view the specific data for a selected FP.
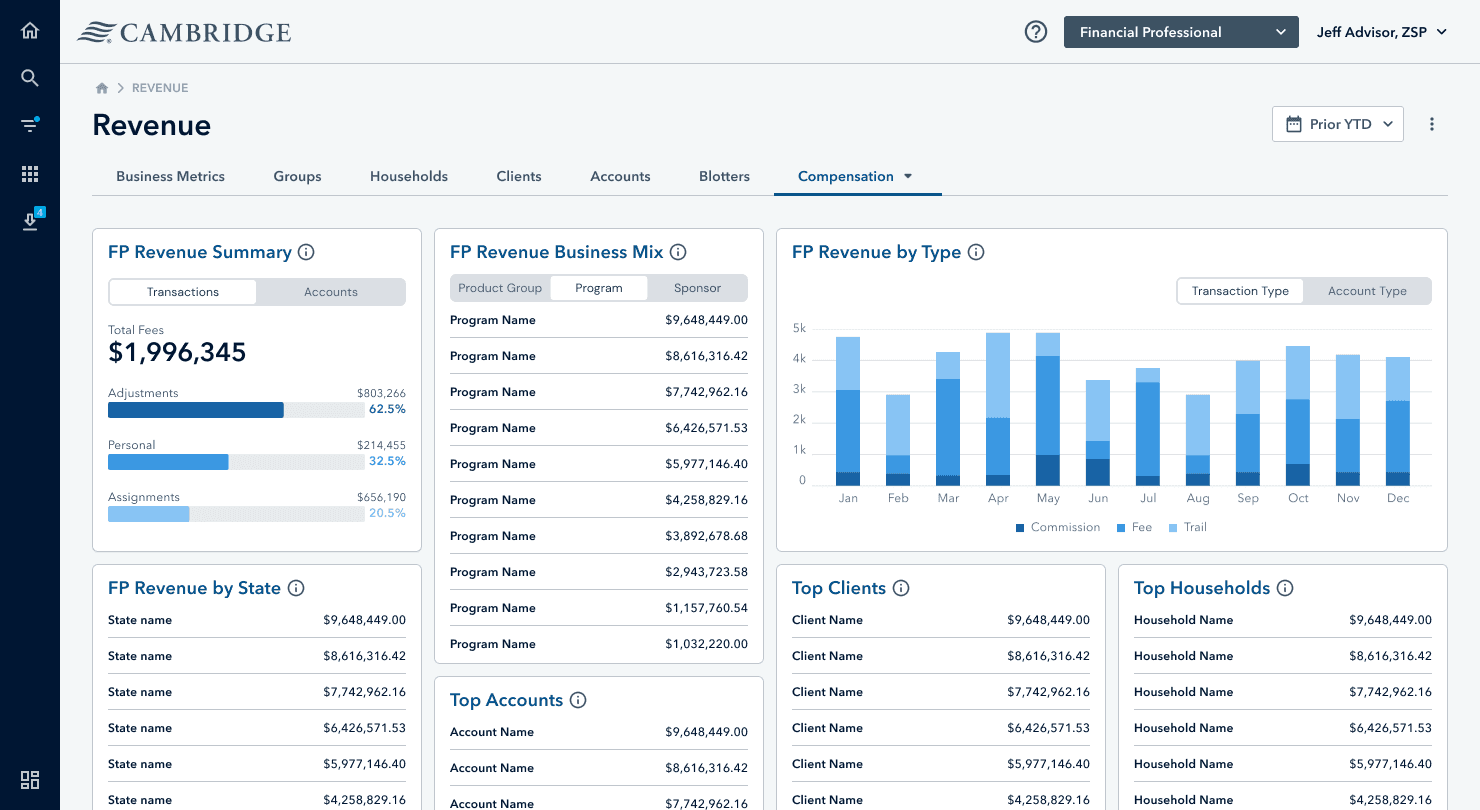
Financial Professional
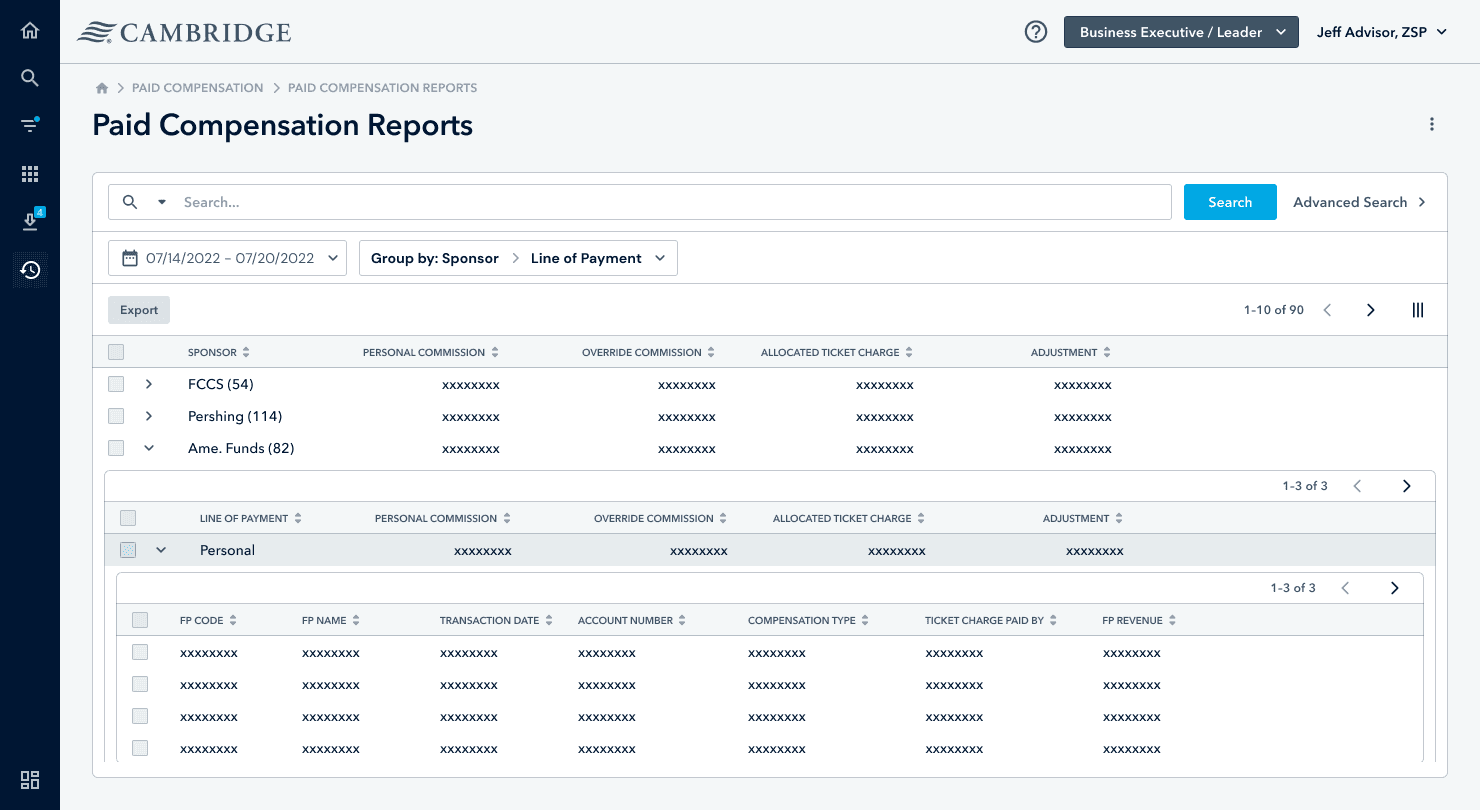
The Financial Professional can see all the data related to their revenue, including data that is hide from the BE.
Grouping
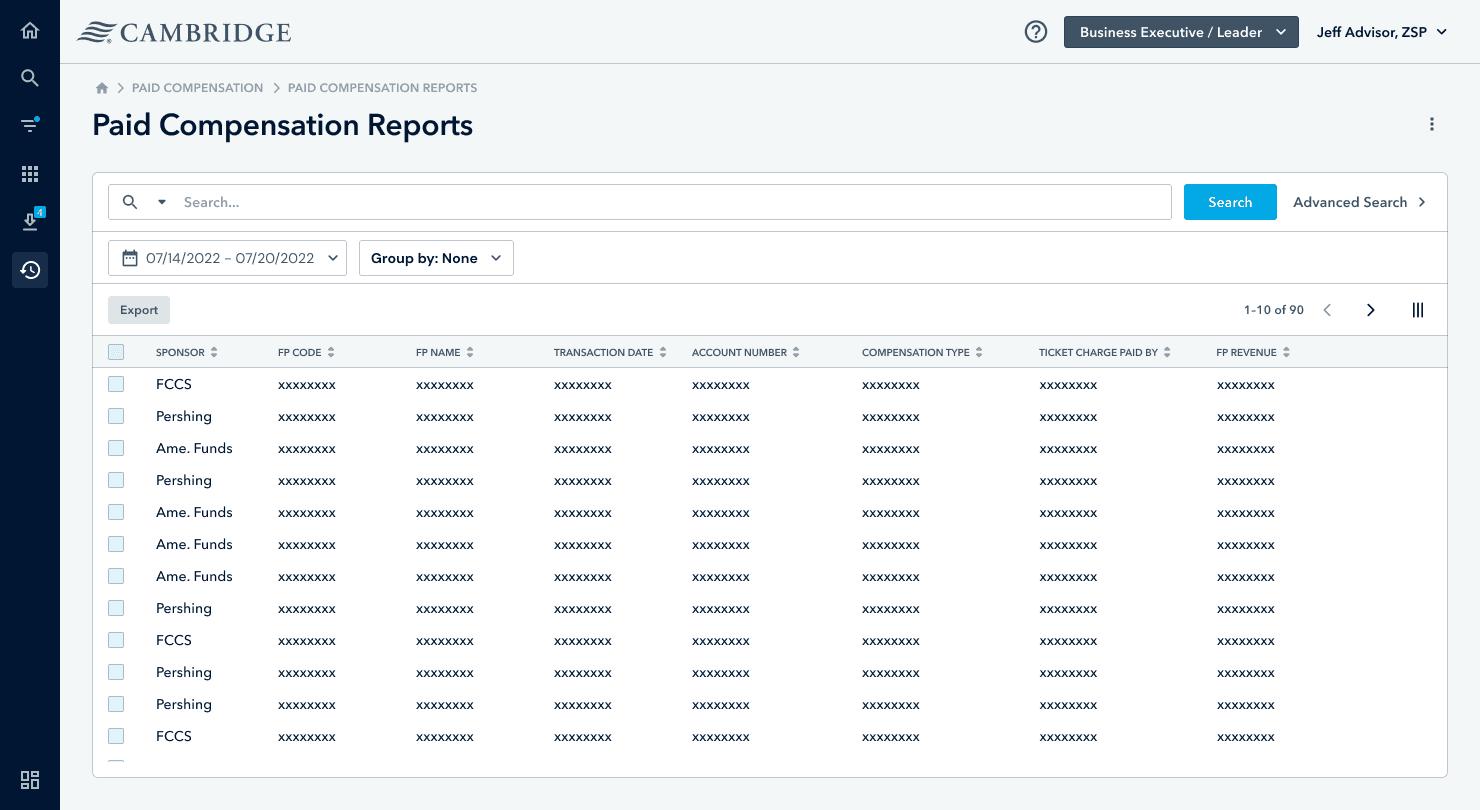
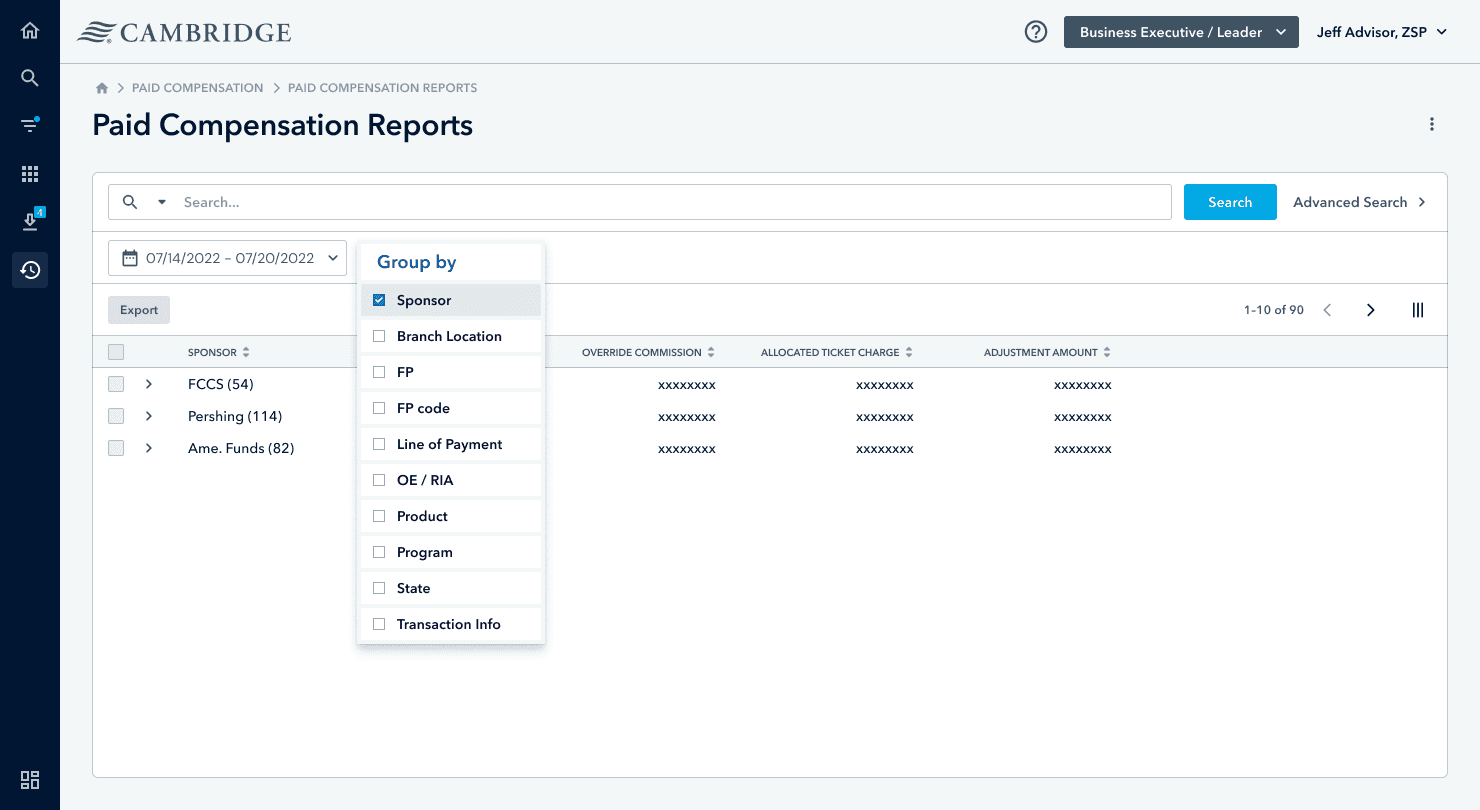
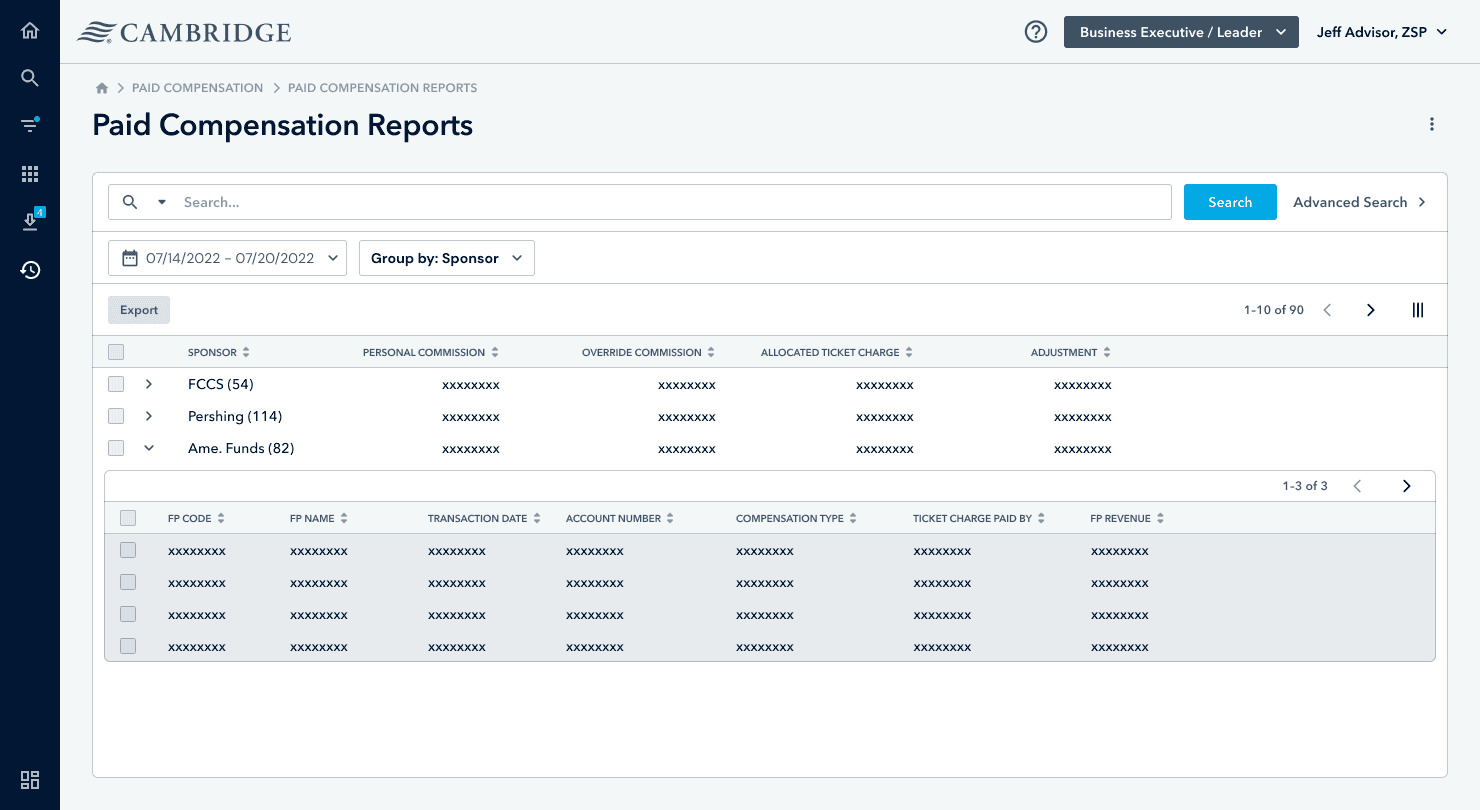
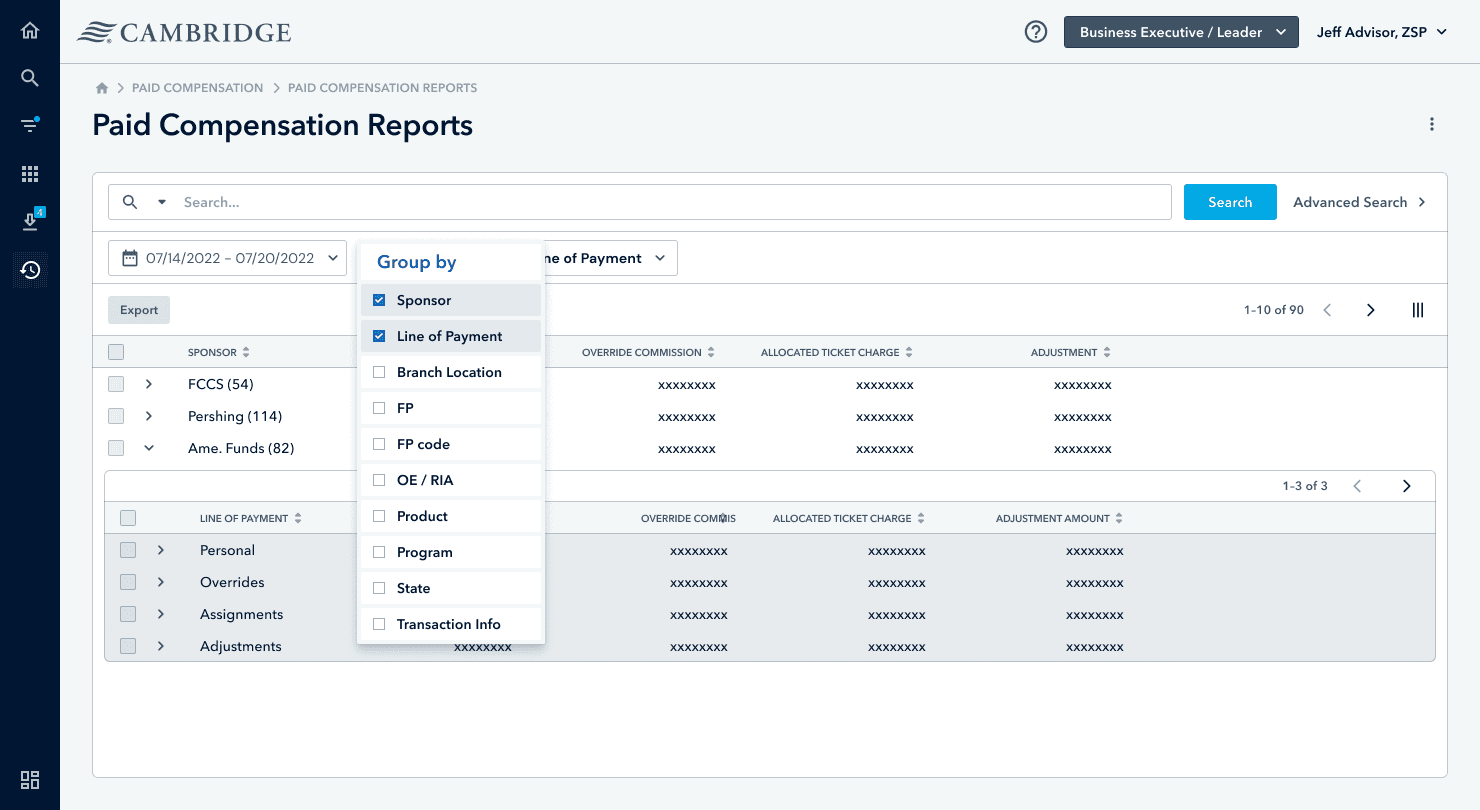
A grouping feature in a finance application allows users to organize and categorize their financial data, such as transactions, accounts, or investments, into meaningful clusters. This feature helps users quickly identify patterns, track expenses, and analyze financial performance by grouping similar items together.
